The ‘bright spot’ in the global economy for the second half of 2013 is the perceived stronger than expected recovery in the US economy.
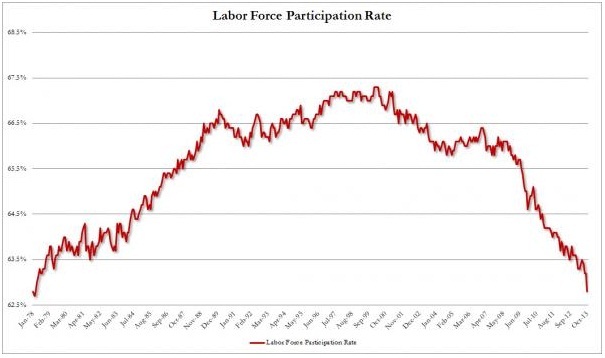
As with the rating agency scandal, reality often bears no resemblance to the information proffered. The key indicators for a recovery in the USA are, lower unemployment, and GDP growth in excess of CPI growth. The story of the US recovery is largely built on the idea that 2.4 million jobs have been created in the past 2 years. However 2.4 million less people collecting social security is not the same as 2.4 million new jobs. The participation rate in the work force of 158 million has dropped steadily from 66% in January 2009 to 62.8% today. This represents a net 5 million people exiting the labour force. This is despite increases in the participation rate for those over 54 years old, as retirement becomes impossible. The actual unemployment rate (including those not claiming benefits) for those between 18 and 34 years old has increased to an estimated 13%.
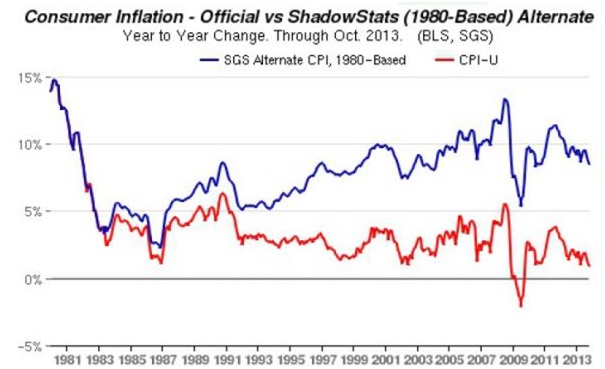
For inflation, using the 1980 methodolgy, where the same basket of goods and services are continually compared, the rate for 2011 is 11.5%, 2012 9.9%, and 2013 9.5%. This matches closely the Chapwood index that measures the 500 most purchased items by the average American. So why are the CPI readings for 2011, 2012, and 2013 1.2%, 3.3%, and 1.2%?
We first need to understand the motivation behind low CPI figures. This is relatively straightforward. Firstly state pensions and social security are CPI indexed which means the governments obligations to its employees expand with inflation. The Boskin Commission in 1995 came up with the controversial view that estimated that inflation was being overstated by 1.1% which would lead to US$1 Trillion in additional costs for the government in the following 12 years. This report was used by the Labour Department, responsible for pensions and social security, to revamp their methodology. Secondly there is strong pressure on the Fed to raise interest rates when inflation climbs above 2.5%. The need to suppress interest rates will be discussed in another document. There have been many changes in how CPI is calculated not least the fact that the items included can be modified now every 2 years rather than every 10. This explains why 2012 was significantly higher than 2011 and 2013. Hedonic adjustments were added, which, for example, indicate a new laptop, although more expensive, is faster, therefore should be indexed down. Substitution is allowed. So that a new Toyota Camry that has the same features as the old Toyota Corolla can be substituted despite being in a lower car category. Reweighting by sector is shown by the fact that in the last 25 years the weighting for food and energy has been reduced by a third, while leisure services have increased by 150%. While this may represent spending patterns for the middle class, for pensioners and those on social security this change is not a reflection of any change in their spending needs. Housing prices are calculated on a rental equivalent approach. This conveniently ignores bubbles in housing prices. Stocks and shares have never been a part of the CPI which means that the Quantitive Easing ‘leakage’ into energy and food prices and ‘stimulus’ in housing and stock markets are not reflected in CPI. Couple this with the deflationary effect of lower lending within the economy (excluding sovereign) and inflation can appear low when the world has seen money printing on a scale never seen before in history.
The reality is that the percentage of people employed in the US is dropping, taking into account the growing population, even if the number of people on social security is also dropping. The US is not in a recovery (3.2% GDP growth with 1.2% Inflation at net +2% growth), it is in recession (3.2% GDP growth with 9.5% inflation at net -6.3%).
